Updated Cost Savings Analysis (May 2022)
The Queen Elizabeth Annex (QEA) PAC executive and several QEA school community members have requested additional information that supports and validates information regarding potential estimated annual operational cost savings should the Board decide to close QEA and relocate students to either Queen Elizabeth Elementary (QE) or Jules Quesnel (JQ) as a group.
This analysis provides more detail regarding determining operating costs at QE, JQ and QEA.
All data used in this report is for the 2019/20 school year. In some cases, salary and supplemental funding data is aggregated to protect the private information of individuals who could be easily identified given the small size of school community.
The cost analyses in this report are based on a District-wide school costing analysis undertaken as a special project in 2020 to support and inform the work of the Preferred School Size Working Group. The most up to date available data for a full school year at that time was from the 2019/20 school year.
Since estimated cost savings are mostly related to staffing costs, which have increased since 2019, actual cost savings are likely to be higher in 2023 and beyond.

Background
Equity of Allocation of Financial Resources: Cost per Student
To inform the work of the Preferred School Size Working Group, staff undertook a detailed analysis of the average cost per student at each VSB school. The overall results of that analysis are available in the VSB Preferred School Size Working Group Final Report. The key findings from the cost per student analysis include the following:
- Annexes generally have the highest operating costs
- Elementary schools enrolling fewer than 300 students have substantially higher operating costs than those enrolling more than 300 students
- Single track French Immersion schools generally have lower operating costs

These general findings of the District-wide analysis are borne out the with respect to QEA, QE and JQ.
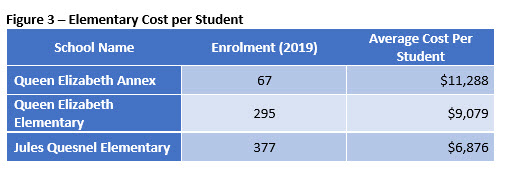
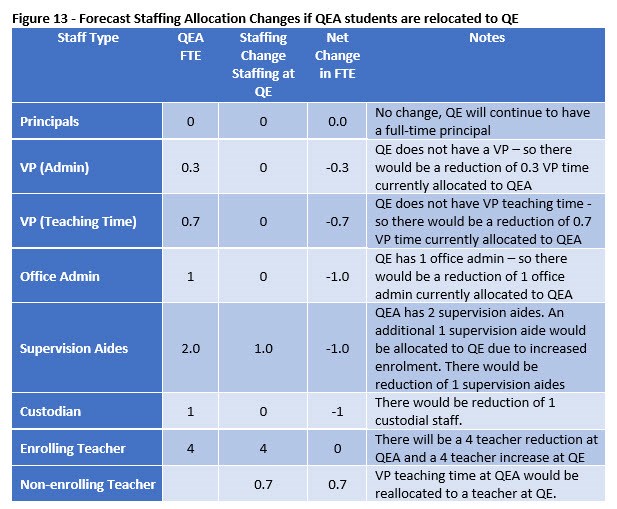
In consolidating the JQ program enrolment at one site or relocating students currently attending QEA to QE the District could achieve estimated savings in operating costs as per Figure 4.

Operational Cost Analysis (2019/2020)
In 2019 a District-wide operational cost analysis for schools was conducted. To facilitate the analysis, the following school-based operating costs were determined for District schools.
Total operating cost is comprised of two categories of cost components:
- Staffing
- Building Operations and Maintenance
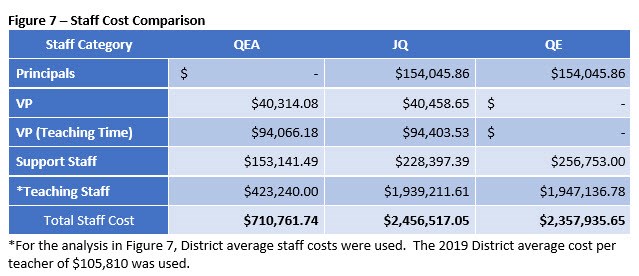
Staffing costs form a much larger proportion of total operating costs than building operations and maintenance costs. It is important to note, no staff would be terminated should the Board decide to close the school. If the Board decides to close QEA, staff assigned to the school would lose their position at that site, however they would continue to be employed by the Board and would be assigned to another school site in the District. The District loses a number staff to regular attrition annually due to retirement, career growth, relocation changes.
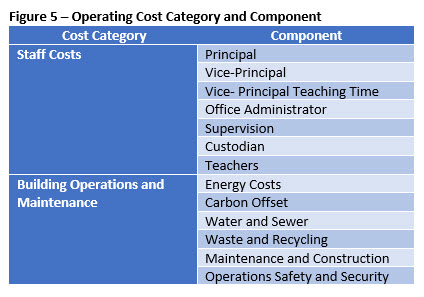
Figure 6 compares the Building Operations and Maintenance components of total operating costs for QEA, JQ, and QE.
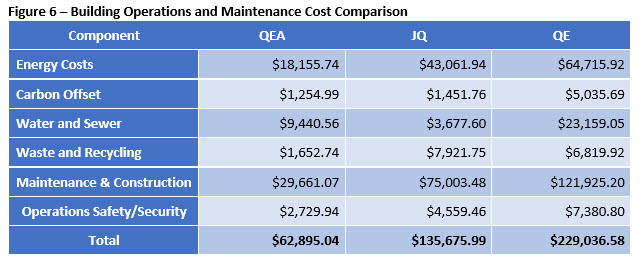
Figure 7 compares the staffing components of total operating costs for QEA, JQ, and QE.

Building Operations and Maintenance
As detailed in Figure 6 – the building operations and maintenance costs for QEA totalled about $63,000 in 2019. If, after closure the school remained unoccupied, the estimated cost savings in this category would be about $49,500. Figure 9 shows the estimated cost savings and assumed reductions in maintenance and operations costs for QEA if the school does not accommodate students. If QEA is leased or sold the entire cost of maintaining and operating the school would be borne by the lessee/owner.
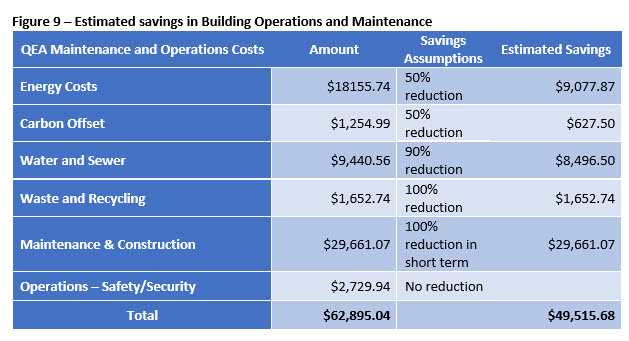
If, after closure the school remained unoccupied, the estimated cost savings from reduced maintenance and operations costs would be about $49,500.
Forecast Staffing Allocation Changes
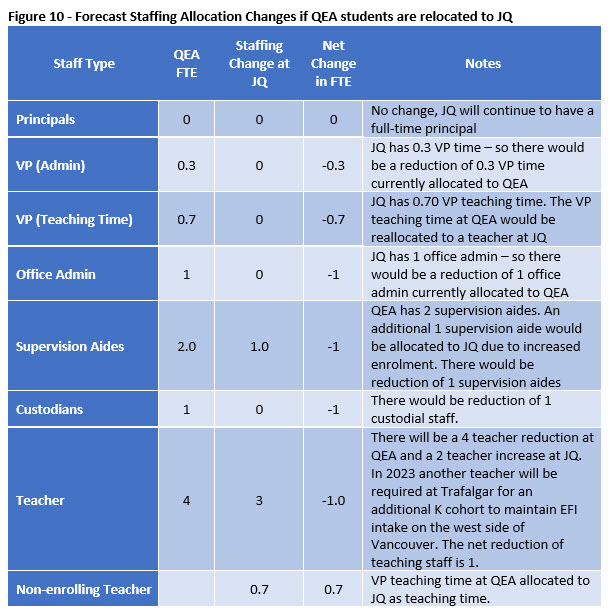
If QEA is closed and students are relocated to JQ the anticipated changes to staffing are detailed below in Figure 10. ‘FTE’ is the abbreviation for ‘Full Time Equivalent’, for example, a teacher working half time is 0.5 FTE.


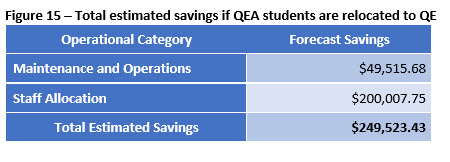
Summary of Cost Savings Findings
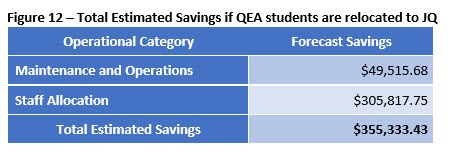
The results of a detailed analysis of projected operational cost savings, should the Board make the decision to close QEA is outlined below.


